Monitor, manage, and troubleshoot your Kubernetes clusters with AI-powered insights.
ops0 provides a unified view of all your Kubernetes clusters with real-time monitoring, incident detection, and AI-assisted troubleshooting. Connect clusters via the ops0 agent and get instant visibility into workloads, resources, and issues.
Keep all clusters, workloads, and health signals in one operator view.
Surface incidents, rollouts, and resource pressure before they turn into outages.
Move from symptom to root cause with logs, events, dependencies, and AI guidance.
Real-time view of cluster health, node status, resource usage, and running workloads.
Automatic detection of pod crashes, resource pressure, failed deployments, and misconfigurations.
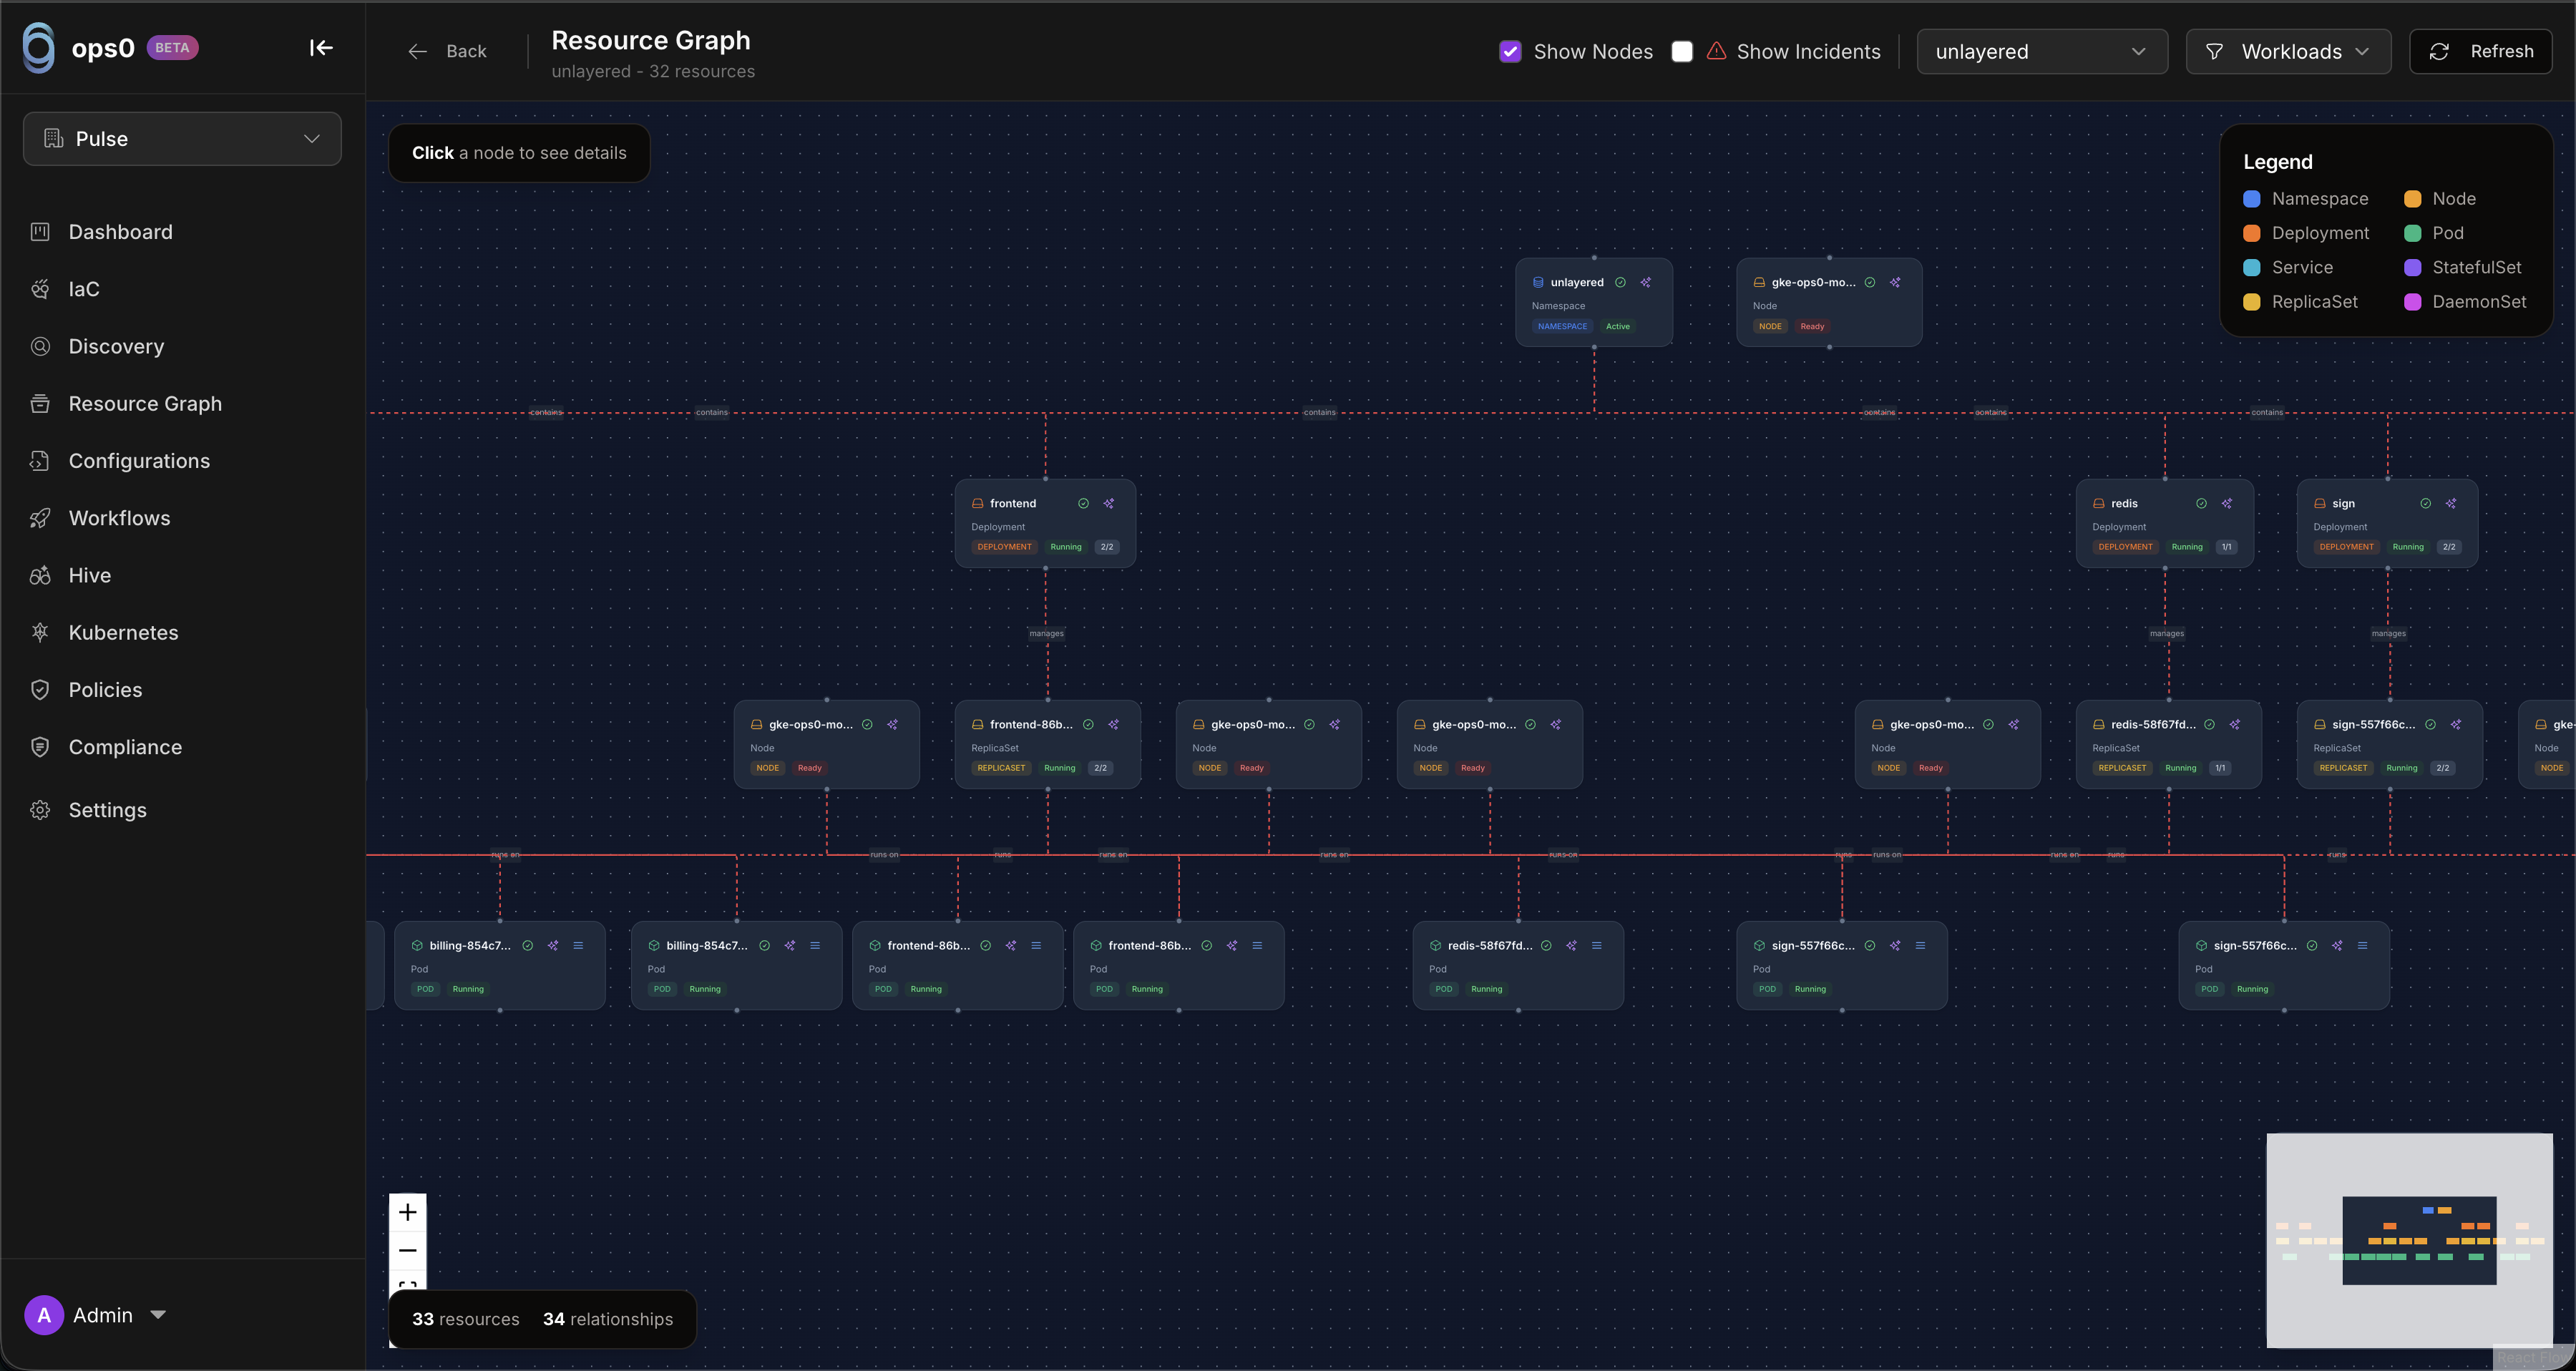
Visual dependency graph with incident severity overlays (P1/P2/P3).
Root cause analysis and remediation suggestions with workload context attached.
Deploy Helm charts and manifests with per-file configuration and planning.
Per-namespace cost breakdown with CPU, memory, GPU, PV, and network costs.
The Kubernetes resource graph provides a visual dependency map for a cluster:
Deploy Helm charts or Kubernetes manifests directly from ops0:
| Feature | Description |
|---|---|
| Per-file configuration | Configure each manifest or Helm values file individually |
| Helm support | Deploy and manage Helm releases |
| kubectl apply | Apply raw manifests to the cluster |
| Deployment planning | Preview changes before applying |
| Outputs | View deployment outputs and applied resource status |
Install ops0 agent in your cluster
View real-time cluster status and metrics
Get alerted when incidents occur
Use AI to diagnose and fix issues
Clusters show real-time health status:
| Status | Meaning |
|---|---|
| Healthy | All major cluster checks are passing and workloads are behaving normally |
| Warning | Minor issues are present, such as resource pressure or degraded rollouts |
| Critical | Immediate operator action is likely required |
| Offline | The cluster is not connected or has stopped reporting |
Incidents are categorized by severity:
| Severity | Typical meaning |
|---|---|
| Critical | Service down, data-loss risk, security exposure, or widespread workload failure |
| Warning | Degraded performance, rollout risk, or resource pressure that needs review |
| Info | Changes, scaling events, or other signals that are useful context but not urgent |
ops0 monitors all standard Kubernetes resources:
| Category | Resources |
|---|---|
| Workloads | Deployments, StatefulSets, DaemonSets, Jobs, CronJobs, ReplicaSets, Pods |
| Networking | Services, Ingress, NetworkPolicies, Endpoints |
| Storage | PersistentVolumes, PersistentVolumeClaims, StorageClasses, ResourceQuotas |
| Config | ConfigMaps, Secrets, ServiceAccounts, Certificates |
| Scaling | HorizontalPodAutoscalers, PodDisruptionBudgets, LimitRanges |
| RBAC | Roles, ClusterRoles, RoleBindings, ClusterRoleBindings |
| Namespaces | Create, view, and delete namespaces |
| Custom | All CRDs installed in the cluster |
Install ops0 agent and connect your first cluster.
Monitor and respond to cluster issues with more context.
Visualize resource relationships and dependencies.
Deploy Kubernetes configurations with ops0.
Here's how ops0 helps you troubleshoot a production issue:
1. Incident Detected
2. View in Resource Graph
The Resource Graph highlights the affected pod and its dependencies:
api-gateway-7d9f8c6b4d-2xkjp shows red border3. AI Analysis
Root Cause Analysis:
━━━━━━━━━━━━━━━━━━━━━━━━━━━━━━━━━━━━━━━━━

The pod is failing to start due to a missing environment
variable DB_PASSWORD. The Secret 'api-gateway-secrets'
exists but is missing the 'db-password' key.

Last successful deployment: 3 hours ago
Recent change: Secret 'api-gateway-secrets' was updated
              45 minutes ago (removed db-password key)

Recommended Actions:
1. Add 'db-password' key to Secret 'api-gateway-secrets'
2. Or update Deployment to reference correct Secret key
4. Resolution
After fixing the Secret:
┌─────────────────────────────────────────────────────────┐
│  production-eks                          ● Healthy      │
│  AWS EKS 1.28 • us-east-1 • 12 nodes                   │
├─────────────────────────────────────────────────────────┤
│                                                         │
│  Nodes          Pods           CPU        Memory        │
│  ━━━━━━━━━━━    ━━━━━━━━━━━    ━━━━━━━    ━━━━━━━       │
│  12/12 Ready    156/200        42%        61%           │
│  ● ● ● ● ●      ████████░░     ████░░░    ██████░       │
│  ● ● ● ● ●                                              │
│  ● ●                                                    │
│                                                         │
│  Recent Incidents                                       │
│  ─────────────────────────────────────────────────────  │
│  ● Warning   High memory usage on node-7    15m ago     │
│  ● Info      HPA scaled api-gateway 3→5     1h ago      │
│  ● Resolved  CrashLoop fixed                2h ago      │
│                                                         │
│  Top Namespaces by Pod Count                            │
│  ─────────────────────────────────────────────────────  │
│  api-gateway      ████████████████████  45              │
│  web-frontend     ████████████          28              │
│  backend          ████████              19              │
│  monitoring       ██████                14              │
│                                                         │
└─────────────────────────────────────────────────────────┘