Track all activity in your ops0 organization. Audit logs provide a complete record of who did what and when.
Navigate to the Settings section.
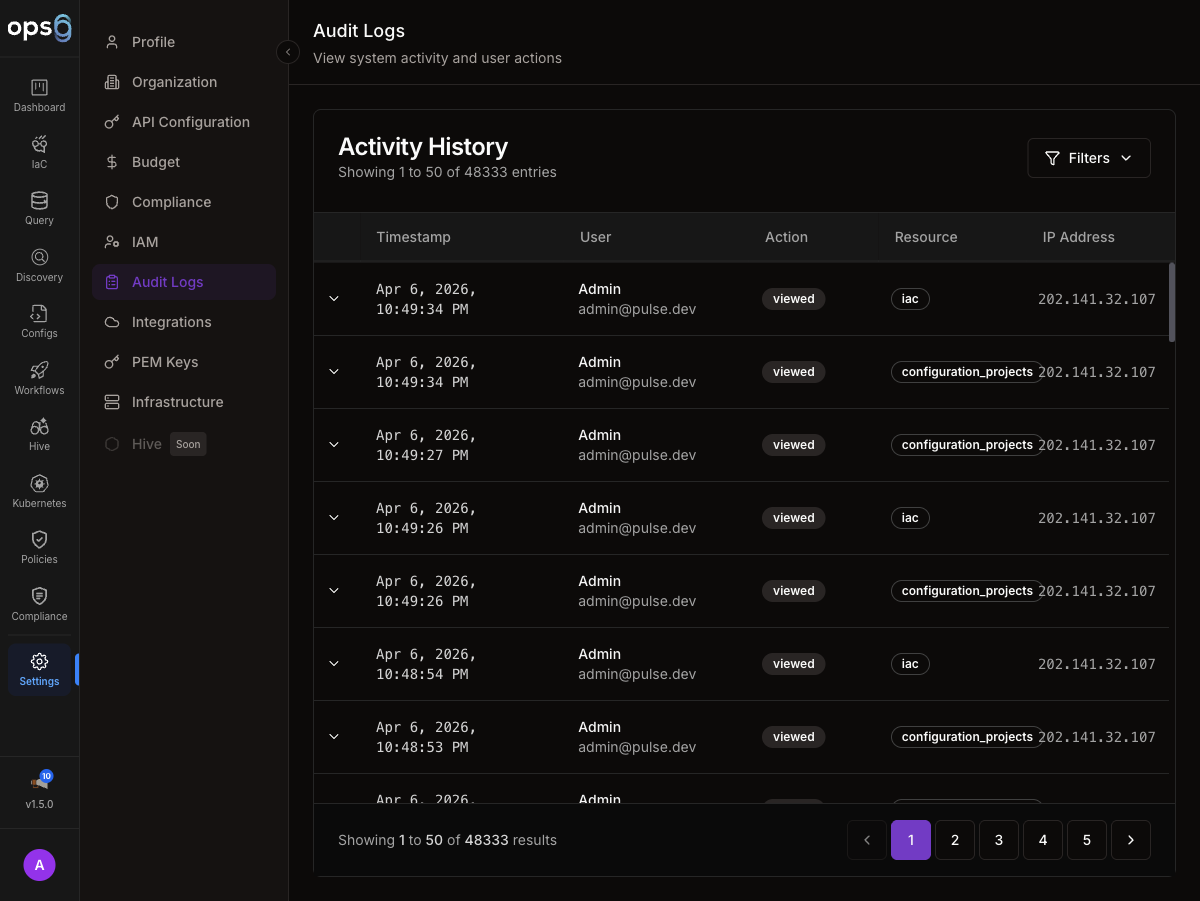
Click on Audit Logs in the sidebar navigation.
Search log entries.
Filter by type, user, date.
Download logs.
All audit entries.
| Column | Description |
|---|---|
| Timestamp | When event occurred |
| User | Who performed action |
| Action | What was done |
| Resource | What was affected |
| IP Address | User's IP |
| Status | Success, Failed |
Each row shows:
┌────────────────────────────────────────────────────────────────────┐
│ 2024-01-15 10:30:45  john@example.com  deployed  vpc-production   │
│ Action: terraform apply                                            │
│ IP: 192.168.1.100  Status: Success                                │
└────────────────────────────────────────────────────────────────────┘
Click on any log entry in the table.
The detail panel opens on the right.
Review full event information including changes and request data.
| Field | Description |
|---|---|
| Event ID | Unique identifier |
| Timestamp | Exact time (with timezone) |
| User | Email and user ID |
| Action | Event type |
| Resource | Resource type and ID |
| Changes | What changed |
| Request | API request details |
| Response | API response |
| IP Address | Source IP |
| User Agent | Browser/client |
User logged in
User logged out
Failed login attempt
Password updated
2FA turned on
Session ended
| Event | Description |
|---|---|
| user.invited | User invitation sent |
| user.joined | User accepted invite |
| user.removed | User removed from org |
| user.role_changed | Role assignment changed |
| user.disabled | User account disabled |
| Event | Description |
|---|---|
| project.created | New project created |
| project.updated | Project modified |
| project.deleted | Project deleted |
| project.file_created | File added |
| project.file_updated | File modified |
| project.file_deleted | File removed |
| Event | Description |
|---|---|
| integration.created | Integration added |
| integration.updated | Credentials updated |
| integration.deleted | Integration removed |
| integration.tested | Connection tested |
| Event | Description |
|---|---|
| policy.created | Policy created |
| policy.updated | Policy modified |
| policy.deleted | Policy removed |
| policy.violation | Violation detected |
| Event | Description |
|---|---|
| workflow.created | Workflow created |
| workflow.updated | Workflow modified |
| workflow.executed | Workflow ran |
| workflow.completed | Workflow finished |
| workflow.failed | Workflow failed |
Select preset:
Select:
Select:
Searches across:
| Search | Finds |
|---|---|
deploy | All deployment events |
john@ | All John's actions |
vpc-prod | Events for vpc-prod project |
failed | Failed events |
Select format:
Exports include:
Filter for suspicious activity:
Track sensitive changes:
Demonstrate:
Track:
Query logs via API:
curl -X GET \
  -H "Authorization: Bearer $API_KEY" \
  "https://api.ops0.io/v1/audit-logs?start=2024-01-01&end=2024-01-31"
| Parameter | Description |
|---|---|
start | Start date |
end | End date |
user | User email |
action | Action type |
status | success/failed |
limit | Max results |
offset | Pagination offset |
Using audit logs to trace and understand a deployment failure.
Notification: Deployment Failed
─────────────────────────────────────
Project:    api-infrastructure
Time:       2024-01-15 14:30:45 UTC
User:       sarah@acme.com
Settings → Audit Logs
─────────────────────────────────────
Filter: Category = Deployments
Filter: Status = Failed
Filter: Date = Today

Results: 1 event found
Event Details
─────────────────────────────────────
Event ID:     evt_abc123xyz
Timestamp:    2024-01-15 14:30:45 UTC
User:         sarah@acme.com (usr_456)
Action:       deployment.failed
Resource:     api-infrastructure
IP Address:   192.168.1.50
User Agent:   Chrome/120.0

Changes:
  error: "Policy violation: S3 encryption required"
  resources_planned: 5
  resources_applied: 2

Request:
  deployment_id: dep_789
  trigger: manual
Filter: Resource = api-infrastructure
Filter: Date = Last 24 hours
─────────────────────────────────────
14:30:45  deployment.failed   sarah@acme.com
14:30:42  deployment.started  sarah@acme.com
14:28:10  project.file_updated  sarah@acme.com  (main.tf)
14:25:33  user.login  sarah@acme.com
Timeline Analysis
─────────────────────────────────────
14:25  Sarah logged in
14:28  Sarah updated main.tf
14:30  Sarah started deployment
14:30  Deployment failed: policy violation

Root Cause: Code change introduced unencrypted S3 bucket
Fix: Add encryption configuration to S3 resource
Incident Report
─────────────────────────────────────
Issue:       Deployment blocked by policy
Detected:    Immediately via policy check
Impact:      No production impact (blocked)
Root Cause:  Missing S3 encryption config
Resolution:  Add encryption, redeploy
Time to Fix: 15 minutes
The audit log provided complete visibility into what happened and when.